How Does the COVID-19 Pandemic Affect Transportation-Related Diesel Consumption in the U.S.?
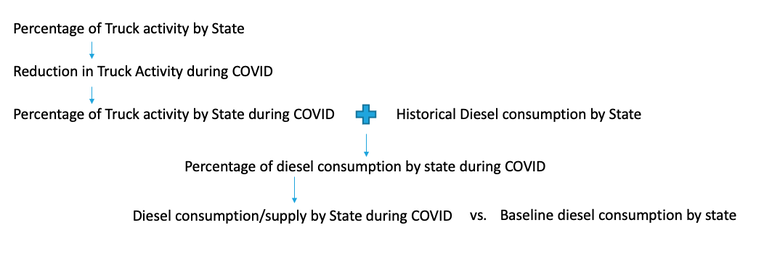
Steps for Disaggregating National Diesel Consumption into State-Level Consumption
- We calculated the baseline state share of truck activities using the 2018 national total truck ton-mile data reported by the Freight Analysis Framework (USDOT, 2018).
- We calculated the baseline state share of diesel consumption using the 2018 diesel consumption by state reported by EIA (EIA, 2018). We estimated the ratio of the baseline state share of diesel consumptions and the state share of truck activities. For most states, the ratios are close to 1, but some states have higher VMT but lower diesel consumption, or vice versa.
- Using the baseline state share of truck activities (Step 1) and the truck daily VMT reduction by the state during the COVID-19 pandemic (INRIX, 2020), we estimated each state’s share of truck activities during the pandemic.
- We estimated the state share of diesel consumption during the pandemic using the state share of truck activities (Step 3). We calibrated the results using the ratios calculated in Step 3. We also ensured that the sum of percentages of all states equals 100%.
- Finally, we estimated the diesel consumption by each state in thousands of barrels per day by multiplying the state share of diesel consumptions (Step 4) by the national total.
References:
- U.S. Department of Transportation (USDOT). (2018). Freight Analysis Framework. URL: https://www.bts.gov/faf.
- U.S. Energy Information Administration (EIA). (2018). State Energy Data System. URL: https://www.eia.gov/state/seds/seds-data-fuel.php?sid=US
- INRIX. (2020). Trip Trends: Normalized Vehicle Miles Travelled. URL: https://analytics.iq.inrix.com/trip-trends.
